
Visualizing Your Data
With the new Charts feature, TableFromJSON lets you see your data in a more intuitive way — instantly, privately, and without setup. Whether you’re testing an API, exploring a dataset, or simply trying to make sense of JSON output, you can now turn that data into a visual form in just a few clicks.
1. Upload or Paste Your JSON
Start by uploading a .json file or pasting your JSON directly into the editor. Once the data loads, you’ll see it appear as a formatted table. To create a chart, make sure your dataset includes: At least one numeric field (for chart values), and One text field (for labels).
2. Generate a Chart Click the “Show Charts” tab to visualize your data.
You can: Choose a chart type — Bar, Line, or Pie Pick which columns to use for the X-axis and Y-axis Instantly preview the result Everything runs in your browser. No uploads, no tracking — just quick, responsive rendering powered entirely on the client side.
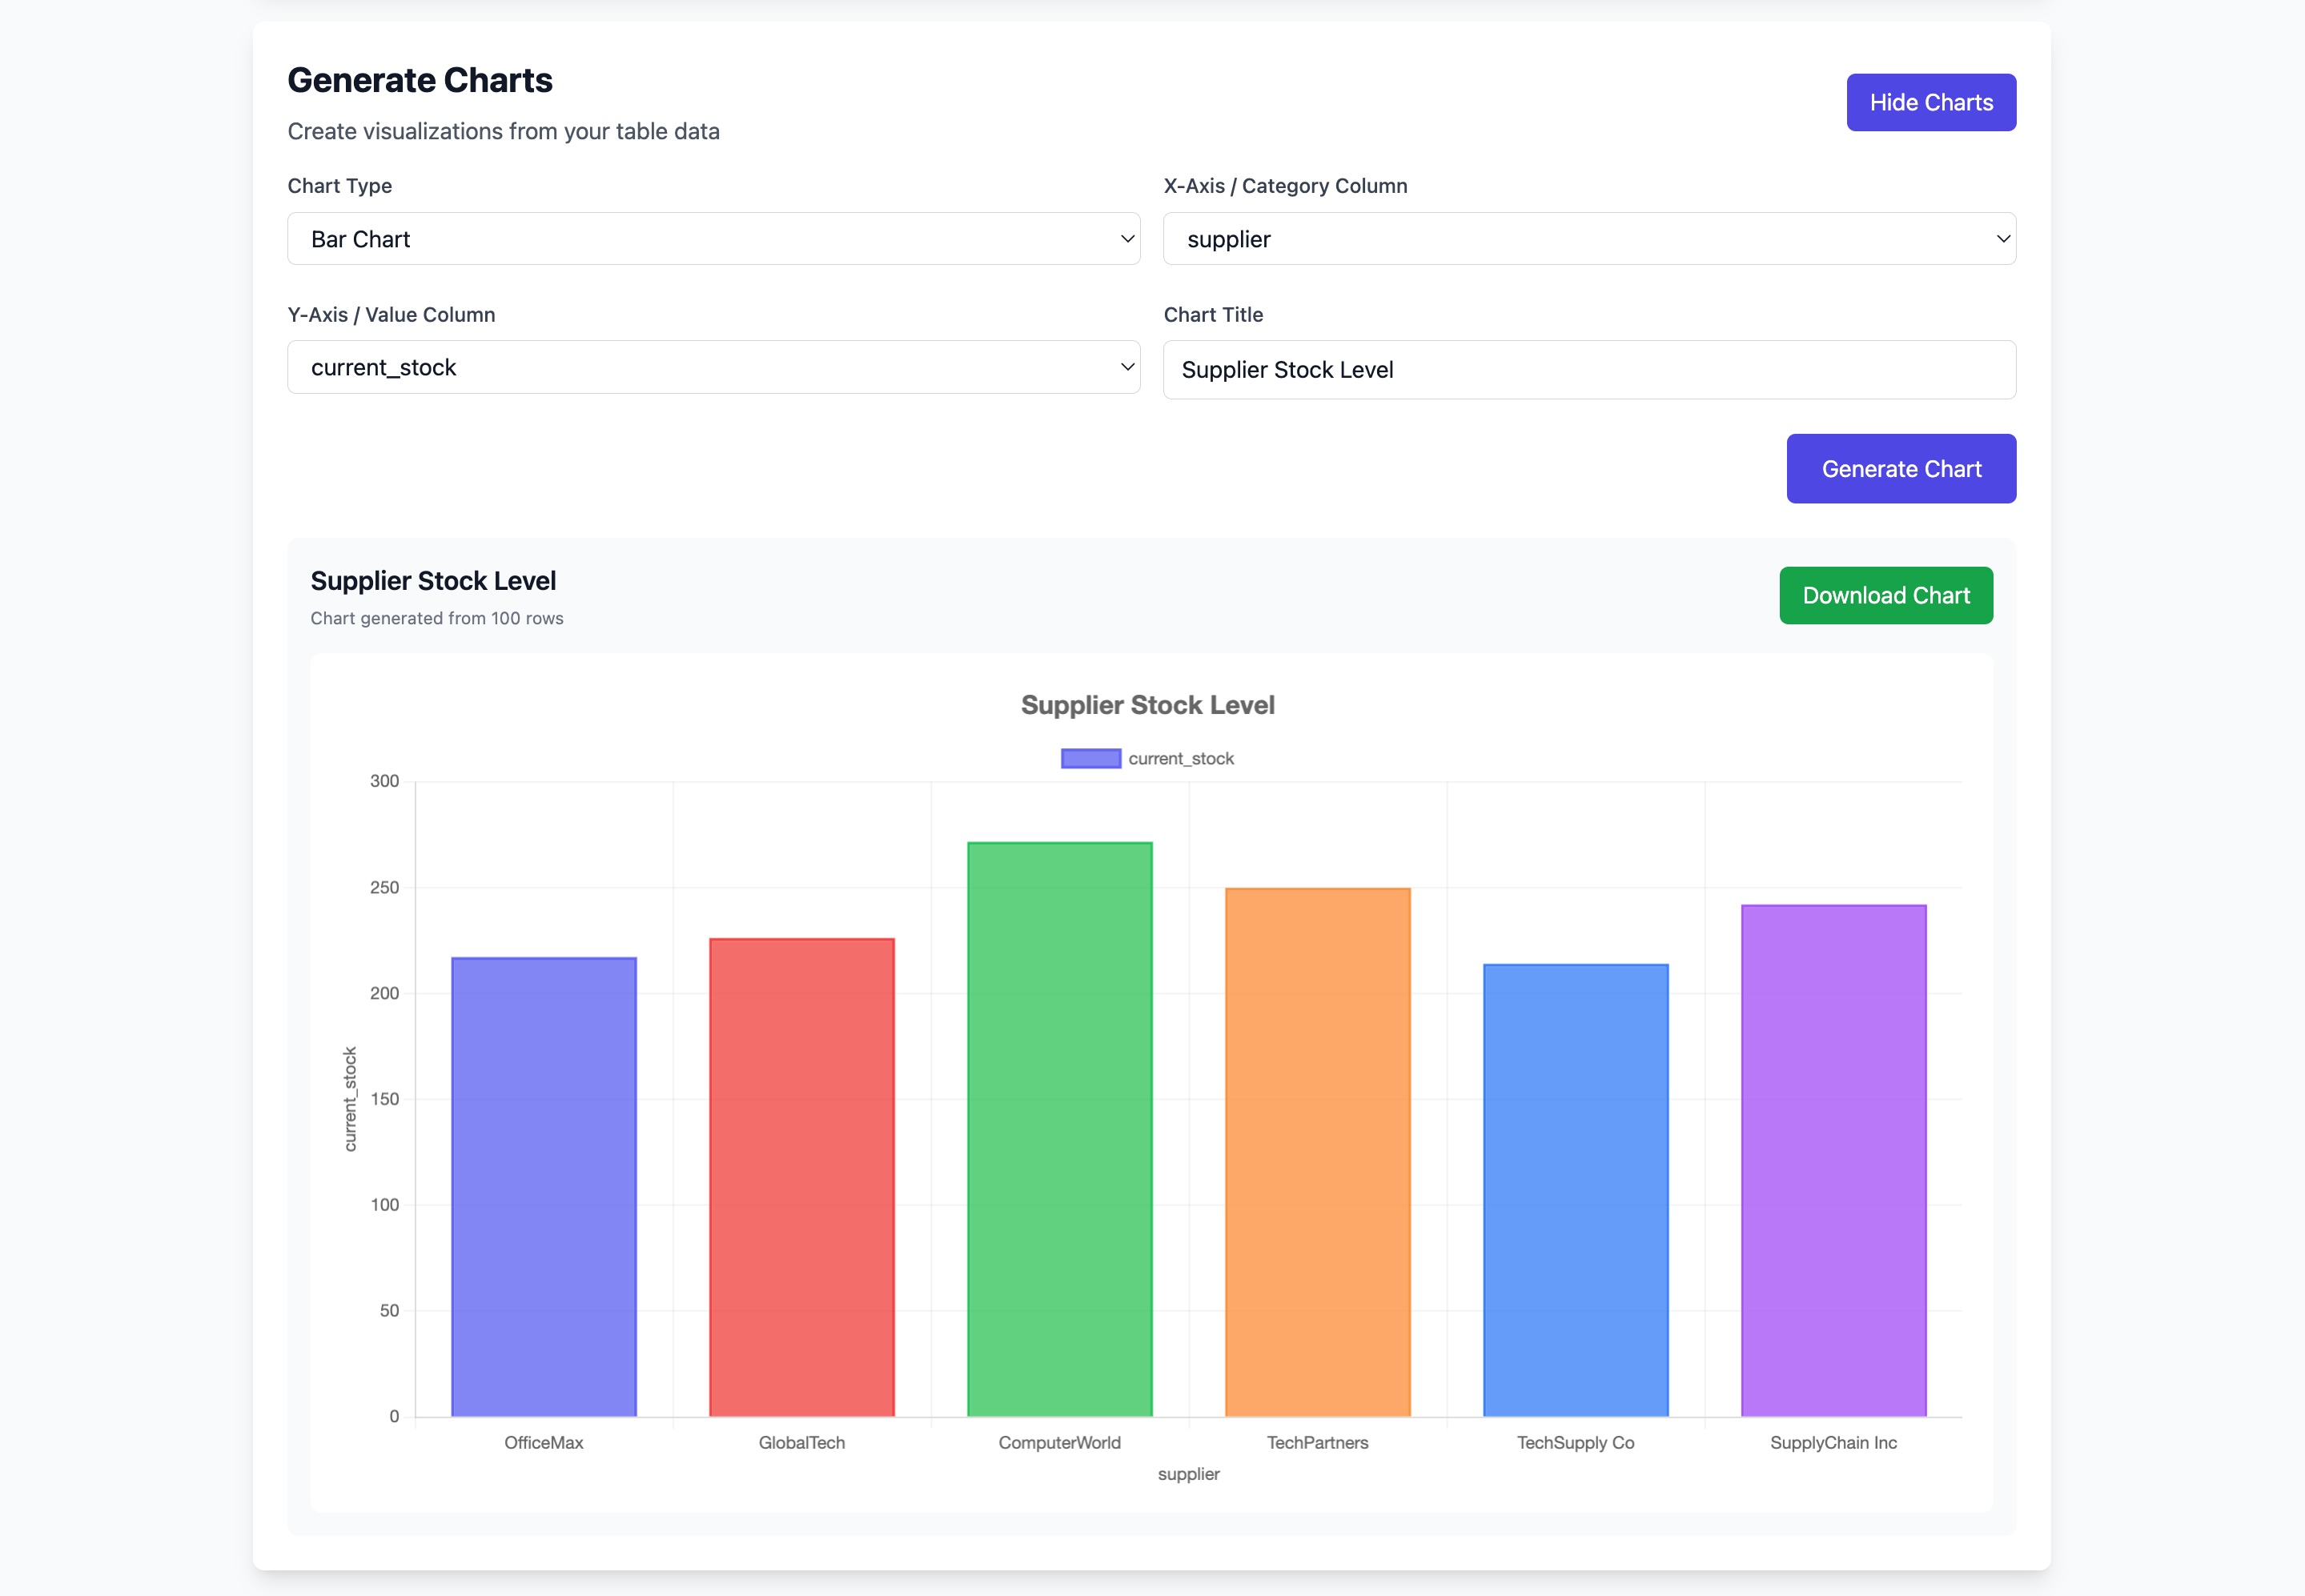
3. Download as an Image
Once you’re happy with how it looks, click “Download Chart” to save it as a .png file. It’s ready to share in presentations, documents, or reports — wherever you need it. This download happens directly on your device, keeping your data completely private.
Premium users will be able to customize chart colors, border, and themes. This will allow deeper visual control while keeping the same lightweight, privacy-first experience.